Annotation Properties and Settings
All annotations that are created are listed in the top section of the Data Properties and Settings panel. Measurements, appearance settings, and tools to create intensity profiles and histograms are available in the lower section of the panel. A pop-up menu is available that lets you export annotation data, save and import annotations, and quickly find an annotation in an image stack (see Annotation Pop-Up Menu).
Annotation properties and settings
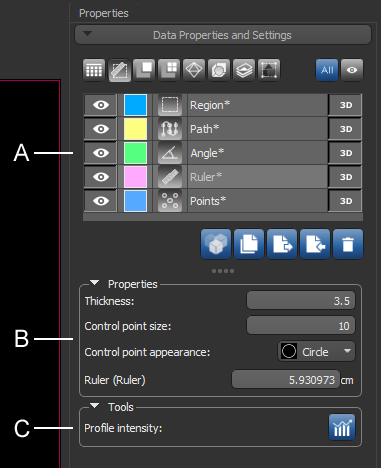
A. Annotations list B. Annotation properties C. Tools
For the selected annotation in the top section of the Data Properties and Settings panel, the lower section shows properties that can be used to modify its appearance and measurements related to the annotation.
All annotations that are available are listed in the top section of the Data Properties and Settings panel.
- Click the Annotations
 icon at the top of the panel to see the available annotations (see Filters for information about filtering the listed items).
 - Click the Eye
 icon on the left side of a listed item to show or hide the annotation in the selected 2D view. Click the 3D icon on the right side of an item to show or hide the annotation in the 3D view of the selected scene. See Object List for more information about changing the visibility of an object.
 - Click the Color swatch on the left side of a listed item to open the Color dialog. In this dialog you can choose a new color for the annotation.
- Select an annotation to view related measurements, modify its appearance, and access additional tools (see Annotation Properties and Annotation Measurements).
The properties available for modifying the appearance of the annotation and its control points are described in the following table. The different measurements available for each annotation are also described below.
| Description | |
|---|---|
|
Thickness |
Indicates the thickness (in screen percentage) of the contour that defines the shape of the annotation.
|
|
Show caption |
If selected, the measurement(s) associated with the annotation will be shown onscreen. |
|
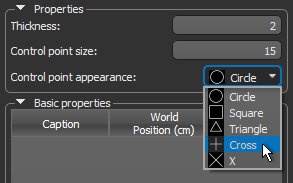
Control point size |
Indicates the size (in screen percentage) of the annotation's control points.
|
|
Control point appearance |
Let you choose a shape — circle, square, triangle, cross, or "X" — for the annotation's control points.
|
|
Measurements |
The measurements shown are dependent on the type of annotation selected (see Annotation Measurements below). |
The measurements shown as part of the annotation properties are dependent on the type of annotation selected, as described below.
| Description | |
|---|---|
|
Point Set tool |
The native value for each point in the dataset, along with its coordinates (see Using the Points Tool). |
| Ruler tool |
The distance between two points (see Using the Ruler Tool). Dataset values along the length of a ruler can also be plotted in an intensity profile (see Profiling Intensity). |
| Angle tools | The angle between two lines (see Using the Angle Tools). |
|
Path tools |
The length of the path, as well as the area of a closed path (see Using the Path Tool). Dataset values along the length of a path can also be plotted in an intensity profile (see Profiling Intensity). |
| Region tools |
The area and perimeter of the selected portion of an image (see Using the Region Tools). The minimum, maximum, mean, and standard deviation values of a dataset can also be plotted in histograms (see Plotting Region Histograms). |
If required, your change the length and angle units used for the measurements in the active scene (see Selecting the Views Preferences for information about choosing a default unit and significant digits for measurements).
- Select the view with the required measurement.
- Click the Change Unit button in the Scene's Views Properties panel and then choose the required unit in the Length Unit or Angle Unit drop-down menu.
Tools to create intensity profiles for rulers and paths, as well as histograms for regions, are available in the lower section of the panel (see Profiling Intensity and Plotting Region Histograms).


